The Line Spectrum Mode: The Axis Is Logarithmic Because the Bins Are
Line Spectrum draws its samples at evenly spaced x positions and still gives you a logarithmic frequency axis. The curve is in the analyser, not in the renderer, and that distinction is worth understanding.
The catalogue describes Line Spectrum as A smooth log-frequency line with stable peak behavior. Read the drawing code on its own and that sentence looks wrong, which makes this the most interesting post in the set: the claim is true, and none of the evidence for it is in the file that draws the line.
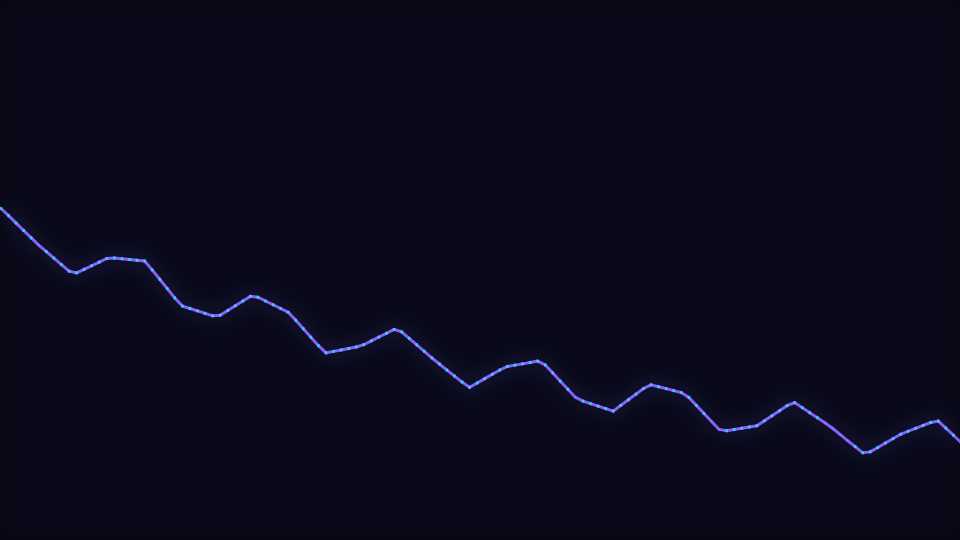
What the renderer actually does
The draw code places sample number i at i divided by the last index, times the width. That is a strictly even spacing. It does not bend the axis, it does not call the catalogue's logarithmic element-band helper, and the resampler that feeds it interpolates linearly between whatever bins it is given. If you audit the renderer alone, you will conclude the axis is linear in bin number, and you will be right about the renderer.
There is a logarithmic curve in this codebase and this mode never touches it. It lives in the motion kit, has a base of 40, and is reached through the element-band helper that the bar, ray and ring engines use to give element number i its own slice of the spectrum. This mode does not draw elements. It draws a polyline over an array, so it has no element index to curve.
Where the curve actually is
Two hops upstream. The per-frame audio snapshot fills its bin array from the analyser's 128-band FFT accessor, and that accessor does not hand back raw FFT bins. It maps its bands logarithmically between 20 Hz and the lower of 20 kHz and the Nyquist frequency, using base-10 logarithms of those two endpoints to place each band.
So the array this mode walks is already log-spaced in frequency. Walking it at even x intervals therefore produces a logarithmic frequency axis, which is exactly what the catalogue claims. The axis is log because the BINS are log, not because the drawing bends anything, and if you ever move this mode onto a raw linear FFT source the description stops being true without one character of the draw code changing.
Why a log axis is the right one
Pitch is logarithmic. Every octave doubles the frequency, so on a linear axis the octave from 20 Hz to 40 Hz gets 20 Hz of width and the octave from 5 kHz to 10 kHz gets 5,000. A linear spectrum spends most of its width on the top two octaves, which on ordinary material are the quietest and least interesting. Log spacing gives every octave the same room.
Resolution, and the dead tail
Bins sets how many samples the line is built from, shipped here at 128 and capped at 256 inside the branch. Spectrum range then trims the top of the array before resampling. That control exists because 8 kHz sits at about 86.7% of the bin array: at a range of 1 the right-hand eighth of the line is near-silent air on most material and barely moves, which is a large part of what makes an untuned spectrum look inert.
Smoothing is applied last, as a one-pole filter across frames rather than across bins. It smooths the line in TIME: a high value makes the curve glide and a low one makes it chatter. It does not blur one frame's shape sideways.
Peak hold, made legible
This mode ships a peak hold of 420 milliseconds, and that value is worth a second look. The draw code reads it and the markers honour it, but the Spectrum engine declares no peak-hold control at all: the number arrives through this mode's own authored defaults and there is no slider for it in either editor. The hold you get here is the hold the mode was written with.
Each held peak is drawn as a small mark a few pixels wide above the curve, and the marks FADE across their hold rather than vanishing at the end of it. That is what makes the duration legible from a single frame: with a hard expiry, a short hold and a long one produce identical pictures and you could only tell them apart by staring at one marker until it disappeared.
Height, anchor and headroom
At the default bottom anchor the baseline sits at 94% of the frame height, which is nearly flush. Sample height is a fixed amplitude plus contributions from level, beat pulse and onset burst, and the whole thing is soft-limited against the distance from the baseline up to the top of the frame box. Soft-limited, again, rather than rescaled: dividing by the worst case would shrink ordinary levels to leave room for peaks that mostly never come, so the spectrum would read as permanently quiet.
When to reach for it
Anything that wants an honest readout rather than an effect: mix demos, plugin walkthroughs, mastering content, and the analytical half of a music channel. It is one row and one stroke, so it is also the cheapest thing in the engine to render at high resolution. For the same data with history behind it, read The Frequency Ridge Mode: Only the Front Row Is a Ridge; for the underlying transform, How FFT Turns Audio Into Visualizer Bands.
Open Line Spectrum in the gallery or go to the editor.
Reviewed by the editorial team. Report a correction.
Keep reading
Was this page helpful?
Anonymous. Only this page’s address and your yes/no are recorded, and only if you allowed analytics cookies.
Ready to make your own?
Open the editor, drop in a track, and export a watermark-free video: free, no account.
Open the Editor